The graph for your lab should represent the data collected. Think about what we measured and observed for...plant height. Now because we used multiple samples (in case of bad seeds), you will need to average the daily height of the plants that sprouted. We will assume that any plant that never sprouted was due to a bad seed (still a source of error). If one seed sprouted a day later than the others, then you will count that as a zero height and average it in with the other sprouted plants. This goes for the control group as well.
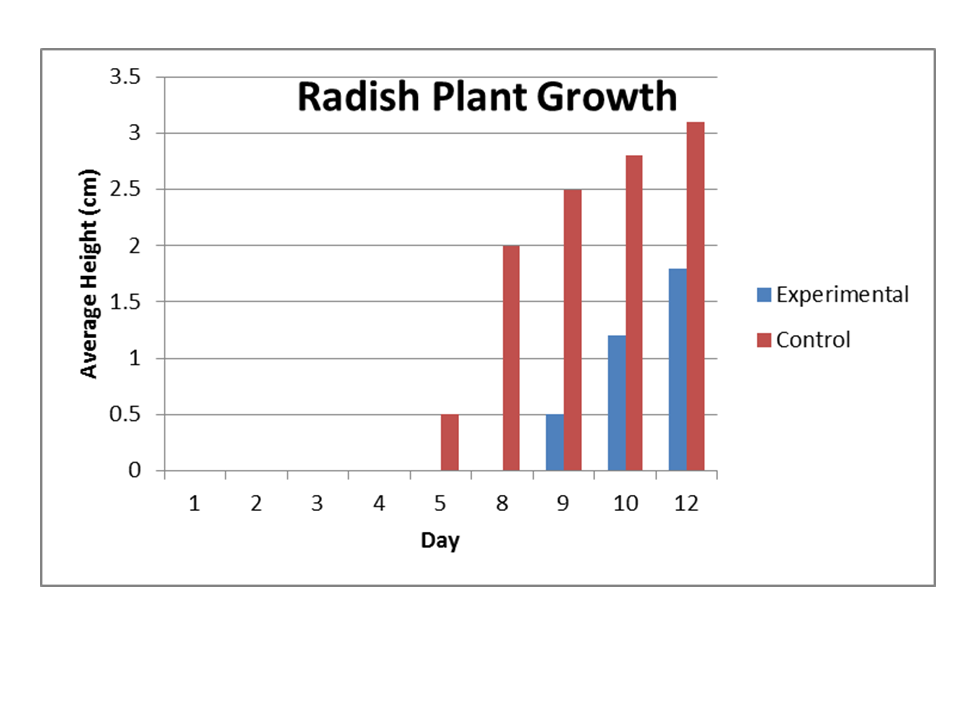
I have posted a sample graph below...(Be sure to notice the gaps in days to missing observational data...weekends and test day)
I have posted a sample graph below...(Be sure to notice the gaps in days to missing observational data...weekends and test day)
 RSS Feed